Minor Specialization Project
Compared specific wear and surface damage in recycled PET and a 10 wt.% graphene grade through 18 pin-on-disc tests at MIT Manipal, with Sohan Kumar Y.
RoleMaterials Engineering · Mini project
- 18 pin-on-disc tests · ASTM G99
- rPET vs 10 wt.% graphene
- Materials Engineering minor, MIT Manipal
Testing
We tested 6 mm specimens against a steel disc at three loads and three speeds. Each run covered 250 m; specific wear rate was calculated from mass loss.
- ASTM G99, dry sliding
- 10 · 20 · 30 N
- 160 · 320 · 480 rpm
- 250 m per run · 60 mm track
Specimens
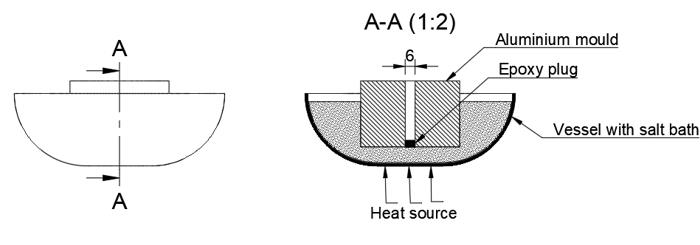
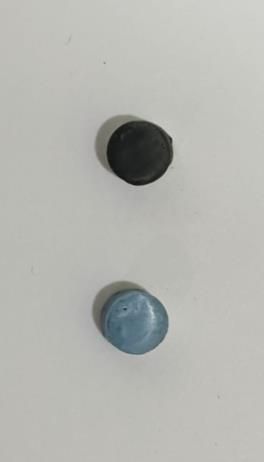
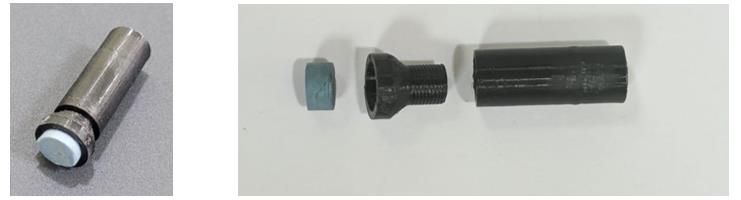
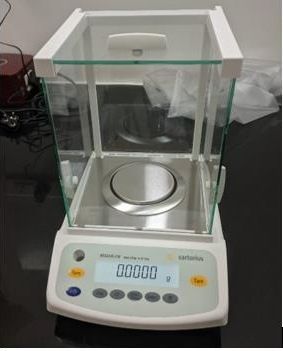
Pins were cast in an aluminium mould heated in a salt bath, then mounted in a two-part 3D-printed PLA holder. Each was cleaned and weighed before and after testing.
Results
Graphene wore more at every load at 320 and 480 rpm, but less at 160 rpm with 10 or 20 N. At 30 N and 480 rpm the graphene grade wore about 29 times faster.
Microscopy
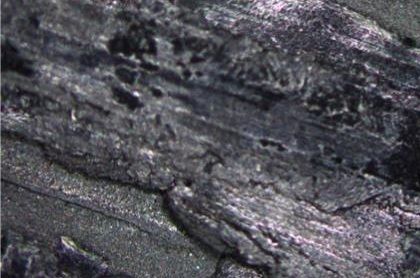
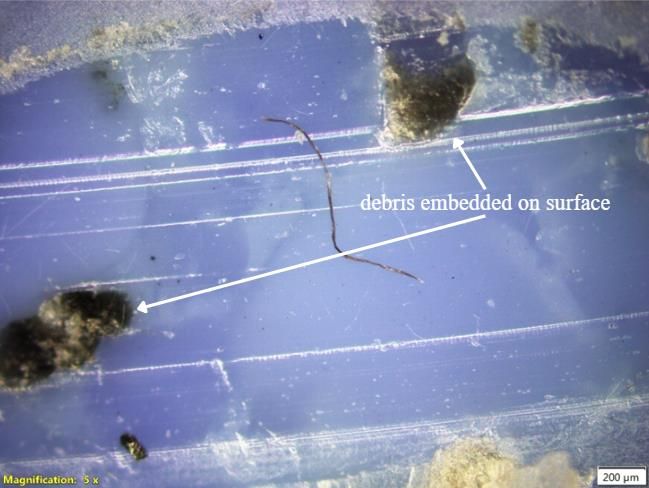
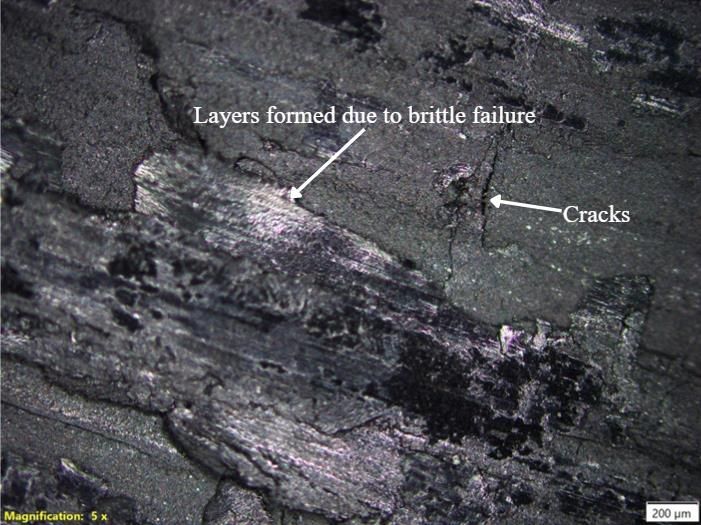
Six worn specimens were examined by optical microscopy. Shown here: both materials at 30 N and 480 rpm.
Conclusions
Wear response varied with load and speed. Mass loss and microscopy showed different damage mechanisms in the two materials.
- Load and speed affected wear
- Different surface damage mechanisms
Limits: one run per condition; friction and temperature were not measured. Further testing is needed before selecting either material for a working part.
Credits
Madhav Sonkusare and Sohan Kumar Y · Materials Engineering minor · MIT Manipal · November 2025.
Guide: Dr. B. Shivamurthy. Testing: Advanced Material Testing Laboratory, MIT Manipal.
Next

Internship @ National Aerospace Laboratories
Studied negative-thermal-expansion filler composites for cryogenic hydrogen fuel tanks at CSIR-NAL, Bangalore.
RoleResearch Intern2024